

|
|
|
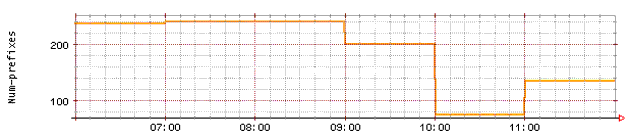
If you view prefix distribution charts for the same time period that is spanned by a trend graph, you may see what appear to be discrepancies between activity peaks or troughs through your service provider links.
For example, the trend graph in Figure 3 shows a significant number of prefixes moved away from link_b at the 10 a.m. hour.
Figure 3: Routes Asserted Through link_b
But if you look at the Distribution Report pie charts generated from database snapshots during that same time period, it appears that the dip in route assertions on link_b does not occur until sometime after the 10:07 a.m. snapshot. See Figure 4.
Figure 4: Excerpts from Distribution reports generated from 10:07 and 11:08 snapshots
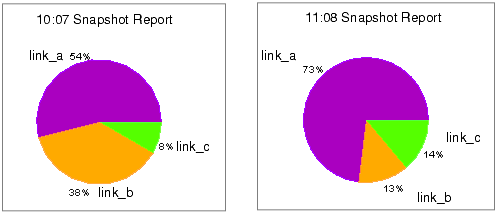
There is no real anomaly in the data, however, only an apparent one.
Trend graphs are drawn from the same data points that are used to generate snapshot reports.
The exact time of data collection can vary from snapshot to shapshot depending on network traffic and the CNA system’s internal activity, but the graphing tool expects there to be exactly one hour between datapoints.
In order to prevent the utility from extrapolating data and thereby decoupling trend report datapoints from snapshot report datapoints, trend reports are artificially aligned to on-the-hour tics on the X-axis.
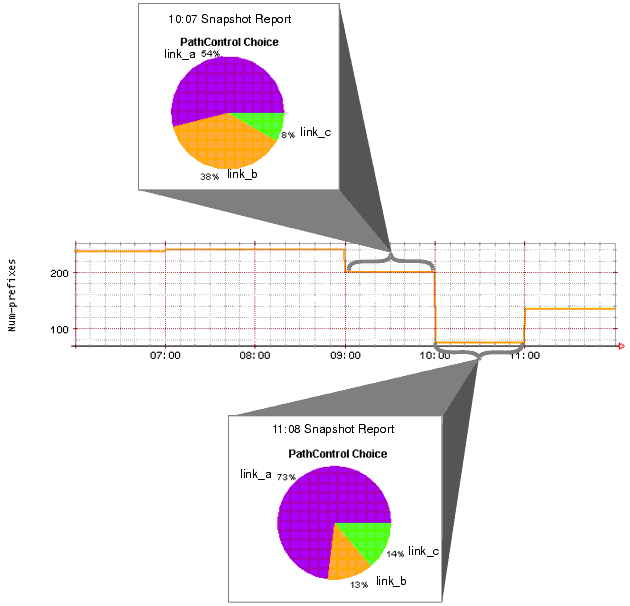
Each hourly segment of the graph shows the value obtained from the snapshot represented by the segment’s right-most tic mark.
The 9 a.m. to 10 a.m. segment of the trend graph shows the value collected by the 10:07 a.m. database snapshot.
See Figure 5.
Figure 5: Trend, Snapshot Time Synchronization
NOTE: No artificial X-axis alignment is done for short-interval trends, such as link usage. The X-axis for those trends show actual datapoint intervals.
|
|
|