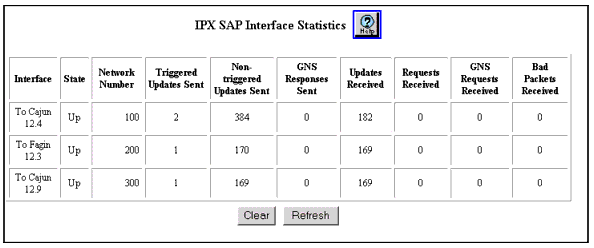
Table�133:�IPX SAP Interface Statistics �
| Parameter |
Description |
| Interface |
The IPX interface associated with this SAP interface. |
| State |
The current state of the SAP interface. |
| Network Number |
The network number of the IPX network associated with the interface. |
| Triggered Updates Sent |
The number of triggered updates sent from the SAP interface. |
| Non-triggered Updates Sent |
The number of non-triggered updates sent from the SAP interface. |
| GNS Responses Sent |
The number of GNS responses sent from the SAP interface. |
| Updates Received |
The number of updates received. Updates may be received periodically even if no changes have occurred. |
| Requests Received |
The number of requests received on the SAP interface. |
| GNS Requests Received |
The number of GNS requests received on the SAP interface. |
| Bad Packets Received |
The number of bad packets received on the SAP interface. |
|