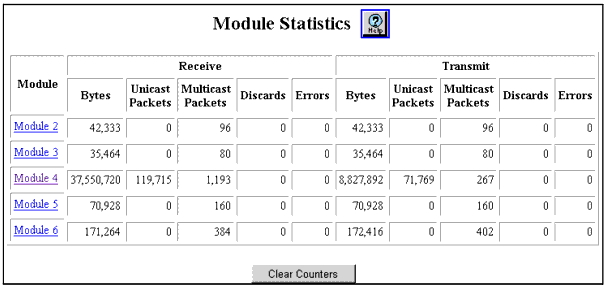
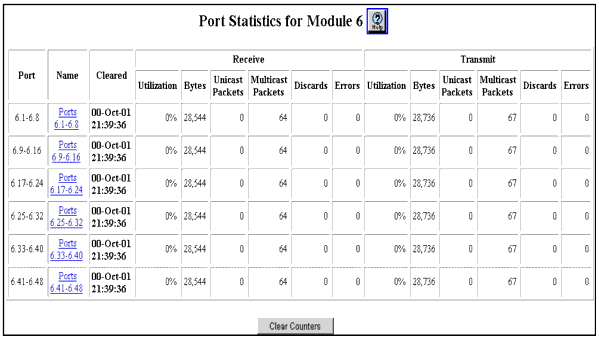
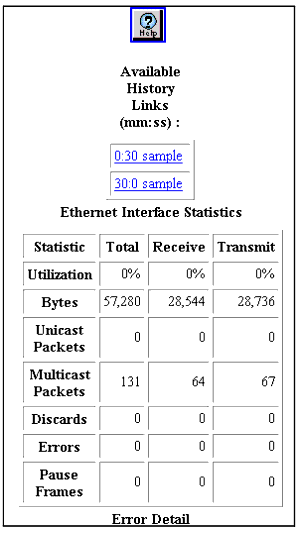
Table�173:�Ethernet Interface Statistics �
| Statistic |
Indicates |
Actions |
| Sample |
The sample number. |
N/A |
| Interval Start |
The date and time this log entry was made. |
N/A |
| Utilization |
Percentage of utilization. |
The percentage of available bandwidth used by traffic. |
| Bytes |
Raw number of octets received at the interface. Provides some indication of the amount of network bandwidth being used. |
A sharp increase could indicate a need to reconfigure the network. |
| Packets |
Counts the raw number of readable Ethernet packets of legal length received at the interface. |
A sharp increase could indicate a need to reconfigure the network. (However, octets are a better indication of bandwidth utilization.) |
| Broadcasts |
Broadcast packets are a normal part of network operation. For example, IP networks use broadcasts as part of Address Resolution Protocol (ARP) to resolve network addresses. |
Uses monitoring to recognize oncoming broadcast storms. Broadcast storms occur when stations are creating traffic that generates more traffic. Possible cause: Broadcasts cause every host on a network segment to process the packet. Possible actions:
- To prevent broadcast storms, use VLANs to limit the area of the network that each broadcast packet affects. In general, each VLAN creates a separate broadcast domain. More VLANs mean less proliferation of broadcast packets.
- Monitor the broadcast rate of your network during normal operation.
- Establish a baseline.
- Use Rate Limiting to reduce broadcasts.
|
| Multicasts |
Normal during network operation. For example, multicast packets are to send target video streams to selected stations on the network, and are part of the operation of the Spanning Tree Protocol. |
Possible causes:
- Too many multicast frames can consume valuable network bandwidth.
Possible actions:
- Using Intelligent Multicasting can significantly reduce multicast traffic on individual ports.
- Segmenting the network into smaller VLANs and routing between them can also help control proliferation of multicasts.
|
| CRC (Cyclic Redundancy Check) or Alignment Errors |
Counts of the number of times that the number of bits in a frame cannot be divided by 8 (that is, cannot be broken into legal octets), and that contain a Frame Check Sequence validation error. Typically caused by turning equipment on or off, and by noise on twisted pair segments. These errors can also result from configuring a network that does not comply with 802.3 standards. In a standards-compliant Ethernet network, CRC or alignment errors represent transit and receive bit errors. The Ethernet standard allows 1 in 108 bit error rate, but you should expect performance to be less than 1 in 1012 packets. Rates in excess of one error per one thousand packets indicate a serious problem. |
Possible causes:
- Defect at the transmitting station.
- Turning equipment on or off. This should cause only a few errors.
- Damaged cables.
- Interference on network cabling.
Possible actions (respectively):
- Use port error statistics to isolate the problem. Check the transceiver or adapter card connected to the port where the problem seems to originate. Also check the cable and cable connections for damage.
- Normal operation, no action required.
- Check cables for damage.
- Inspect cable runs to see if they are too close to noisy devices, and check for problems with network devices.
|
| Undersized Packets |
Count of packets with a valid CRC that violate the minimum Ethernet packet size. These malformed packets are most often the result of software errors. |
Possible cause: Device or application creating non-compliant packets. Possible action: Use a network analyzer to identify the which transceiver which is at the source of the problem. Replace the transceiver, network adapter, or station. |
| Oversized Packets |
Count of packets with a valid CRC that violate the maximum Ethernet packet size. These malformed packets are most often the result of software errors. |
Possible cause: Device or application creating non-compliant packets. Possible action: Use a network analyzer to identify the transceiver which at the source of the problem. Replace transceiver, network adapter, or station. |
| Fragments |
Fragments or runts result from normal collision activity in Ethernet networks. A runt packet is an incomplete packet that is long enough to be detected by an Ethernet interface. |
Possible causes:
- Interference on network cabling.
- A Transceiver attached to the Repeater is generating Signal Quality Errors (SQE).
Possible actions (respectively):
- Inspect cable runs to see if they are too close to noisy devices, and check for problems with network devices.
- Disable SQE on the Transceiver.
|
| Jabbers |
Jabbers indicate that devices on the networks are sending improper electrical signals. Because Ethernet uses electrical signalling to determine whether or not it is okay to transmit, a jabber condition can halt all traffic on a segment. Jabbers do not occur on fiber optic cable and thus do not occur on the 10-Gigabit module. |
Possible causes:
- Bad network interface card
- Repeater network with looped traffic
Possible actions (respectively):
- Replace the network interface card.
- Rewire network to remove the loop.
|
| Collisions (half-duplex links only) |
Counts number of times that packets have collided on the network. Collisions increase as network use of shared segments increases. Therefore, if the collision rate increases without an increase of network use, it might indicate a problem. Guidelines for appropriate collision rates are:
- 10 percent: Normal collision rate for shared Ethernet segment.
- 30 percent: Collisions begin to interfere with performance.
- 70 percent: Practical limit for network to remain functioning.
A full-duplex link should not show collision activity. Collisions are rare in a switched network, unless your switched segments attach to multiple ends stations (a legal configuration option). Collisions do not occur on fiber optic cable and thus do not occur on the 10-Gigabit module. |
Possible causes:
- Busy network
- Broken adapter (not listening before broadcasting)
- Network loop
Possible actions (respectively):
- If you have multiple stations on a switch segment, reconfigure network into segments with fewer stations.
- Isolate each adapter to see if the problem ceases.
- Activate spanning tree to resolve loops automatically.
- Ensure that there are no connections to the same station where both connections are simultaneously active.
|
|


